We’ve spent a lot of time in recent posts talking about the benefits of µTP. We’ve even talked a little bit about how it works here, though much more so in the various technical forums for the community. But sometimes a picture is worth 2^^10 words and I think the graph below says it best. µTP appears to be up to the task of reducing congestion.
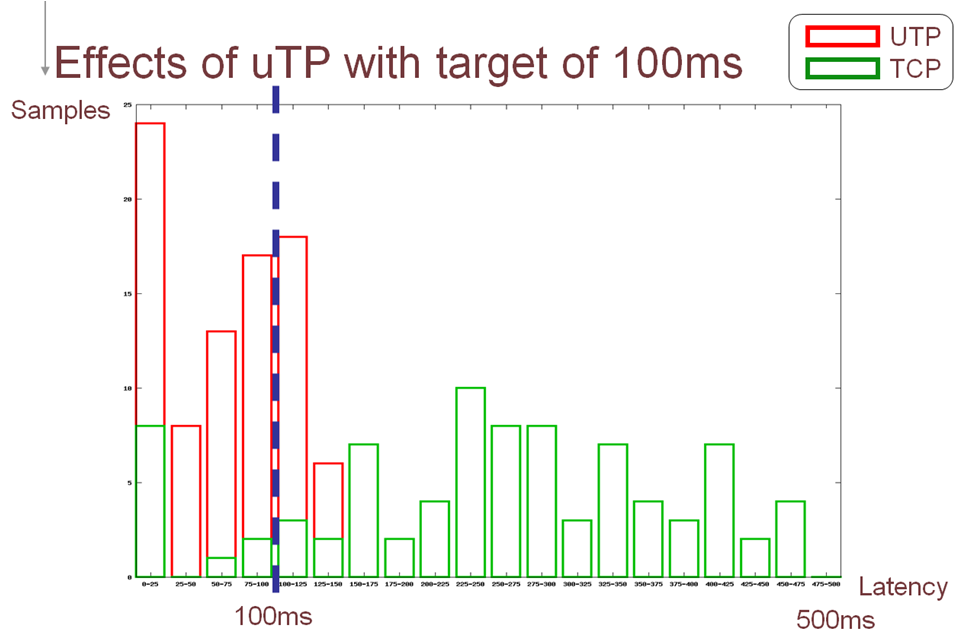
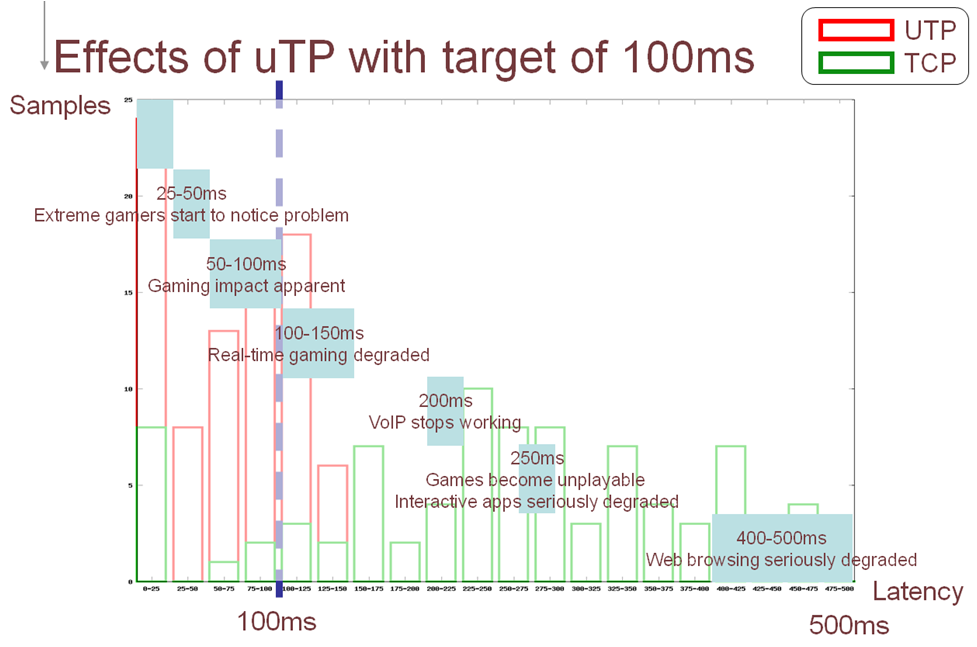
These results are taken from our QA regression tests that we run on each new version of the client that ships with µTP. The test is a simple one. We use a DSL line here in the office and start a client seeding on that DSL line. We then measure the latency seen by other applications, such as VoIP, online games and web browsing, that we run concurrently over the same link. The graph above is a histogram of those latency samples.
The green samples were taken with a client seeding on TCP and the red samples were taken with a client seeding on uTP. (You can tell that these are engineering graphs rather than marketing ones simply enough by the fact that GREEN= bad and RED = good, but you get the picture…). In reading the graph, remember, queuing delay (latency) is a side effect of congestion. More latency in this test means more congestion.
With the target latency set at 100ms, µTP does a pretty good job keeping the latency felt by the other applications near the target. TCP clearly does not and more than congests the uplink. In the process this ruins the network for all of the adjacent applications below.
While much work remains ahead of us (like picking the right target latency), it seems that µTP demonstrates some clear potential to alleviate network congestion wherever the network bottleneck happens to reside. This has obvious benefits for users who will no longer congest themselves, benefits for publishers who want to use BitTorrent but also want to protect their brand when users seed content on their behalf, and benefits for ISPs who should see far fewer support issues with BitTorrent causing congestion and impacting other users on the network.
A win win win.